Reporting
Overview
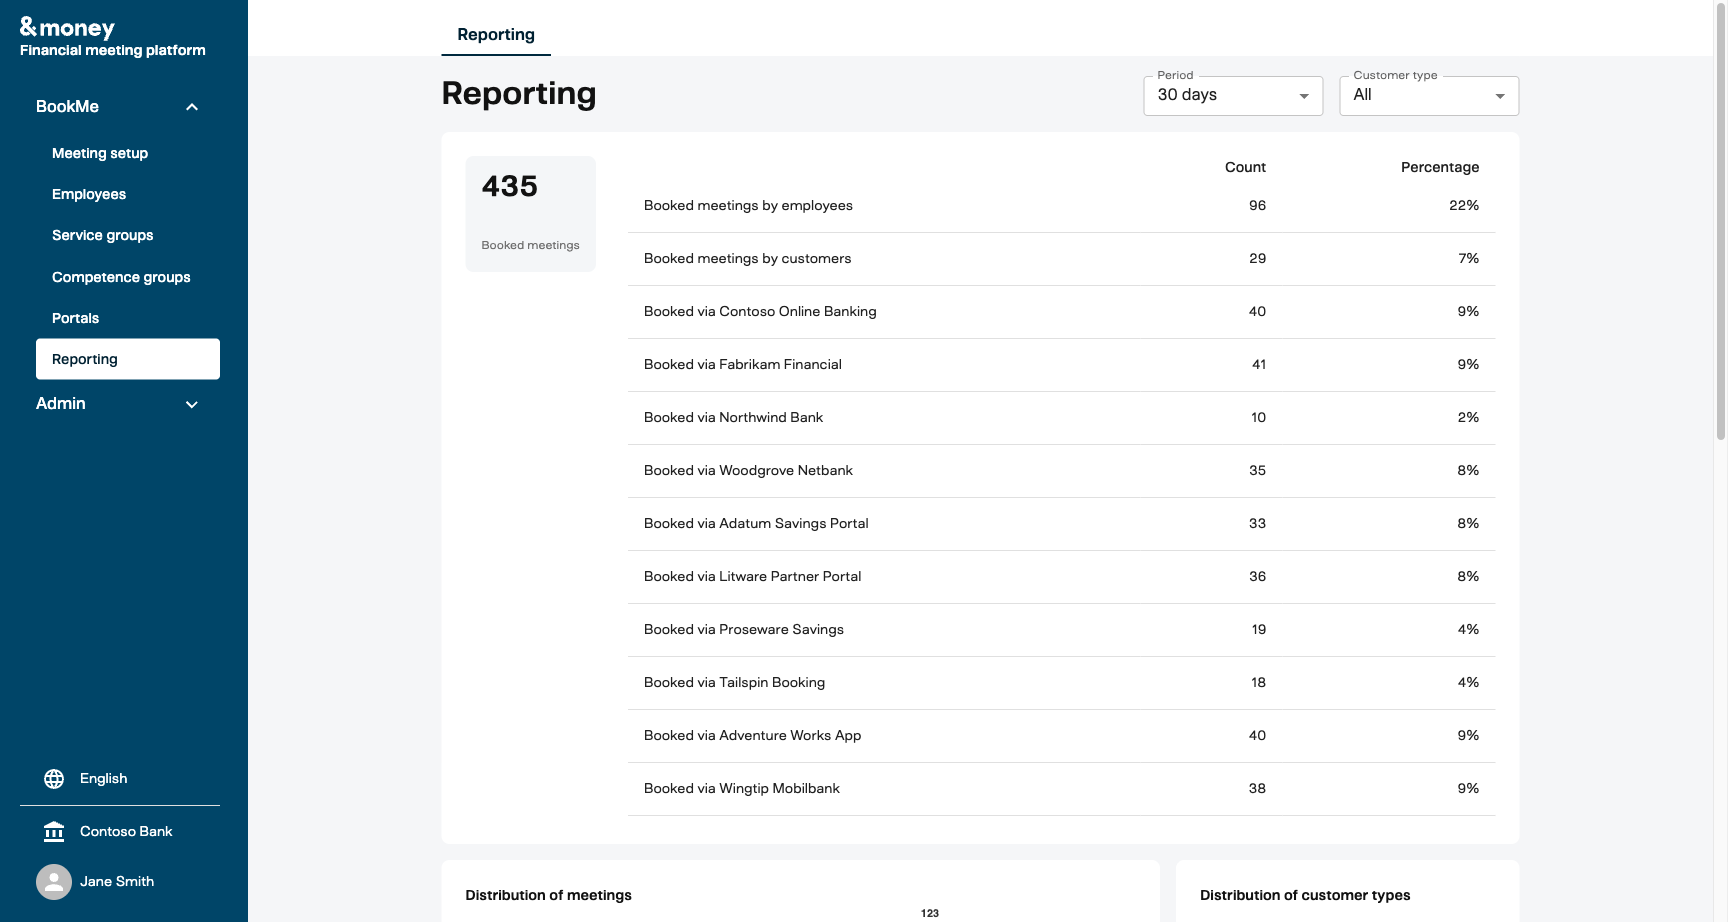
The BookMe Reporting dashboard provides managers and administrators with a comprehensive view of meeting booking activity across their organization. It is available in the Management UI under BookMe > Reporting.
The dashboard gives insight into:
- Total meeting volume and trends over time
- How meetings are booked (by employees, customers, or third-party portals)
- Distribution across customer types, meeting types, and meeting topics
- Weekly booking patterns and source-level breakdowns
Accessing Reporting
- Navigate to the Management UI
- In the left sidebar, expand BookMe
- Click Reporting
The Reporting page is available to users with Manager or Admin roles.
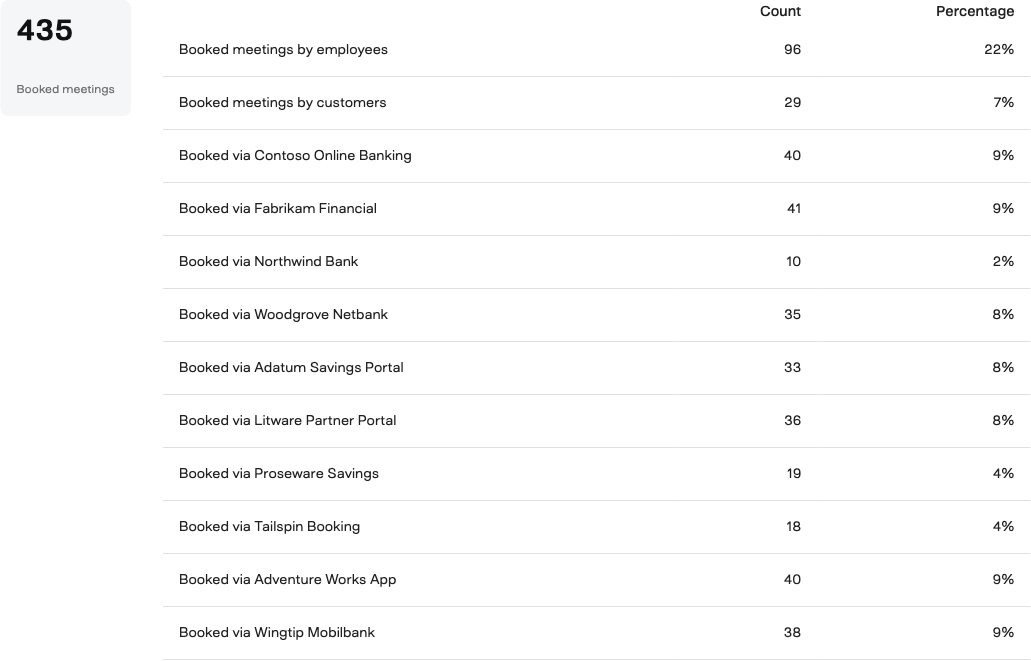
Filters
The dashboard includes two filter controls at the top of the page:
Period
Select the time window for the data displayed. Available options:
| Period | Description |
|---|---|
| 7 days | Last 7 days |
| 14 days | Last 14 days |
| 30 days | Last 30 days (default) |
| 90 days | Last 90 days |
| 365 days | Last 365 days |
Customer type
Filter by customer category. Select All to include every customer type, or choose a specific category to narrow the data.
When a filter is changed, all dashboard sections update automatically.
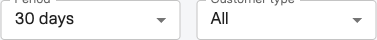
Summary Card and Statistics Table
The top section of the dashboard shows:
- Total booked meetings for the selected period (displayed as a large number)
- A statistics table that breaks down how those meetings were booked
Each row in the table shows a booking source with its count and percentage of total meetings. The rows are grouped into three categories:
Employee bookings
Meetings booked directly by advisors/employees through the Management UI or calendar integration. Shown as “Booked meetings by employees”.
Customer bookings
Meetings booked by customers through direct booking flows (not via a named portal). Shown as “Booked meetings by customers”.
Portal bookings
Meetings booked through third-party portals are listed individually by portal name, for example:
- Booked via Contoso Online Banking
- Booked via Fabrikam Financial
- Booked via Northwind Bank
Each portal configured in your system appears as a separate row, making it easy to compare booking volumes across different portal integrations. Rows with zero bookings in the selected period are automatically hidden.
Portal names shown in the statistics table correspond to the portal configurations set up under BookMe > Portals. See the Portals documentation for setup instructions.
Distribution of Meetings (Bar Chart)
The stacked bar chart shows weekly meeting volumes broken down by booking source.
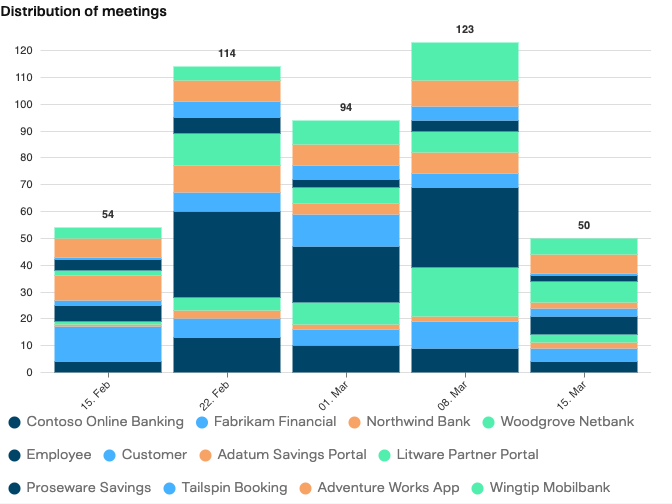
Reading the chart
- Each bar represents one week within the selected period
- The total for each week is displayed above the bar
- Each color segment represents a different booking source (employee, customer, or a specific portal)
- The x-axis shows the week start date; the y-axis shows the number of meetings
Interactive legend
Below the chart is a clickable legend showing all booking sources with their assigned colors. Click on any legend item to highlight that source in the chart, making it easier to trace a specific portal’s contribution over time.
The legend includes:
- Individual portal names (e.g., Contoso Online Banking, Fabrikam Financial)
- Employee bookings
- Customer bookings
Distribution of Customer Types (Pie Chart)
This chart shows the proportion of meetings by customer category. Up to three customer types are shown individually; any remaining categories are grouped under “Others”.
This helps identify which customer segments are most actively using the booking system.
Distribution by Meeting Type
A horizontal bar chart showing the percentage breakdown of meetings by type (e.g., Advisory Meeting, Quick Consultation). Each bar displays the percentage relative to all meetings in the selected period.
Distribution of Meeting Topics
A horizontal bar chart showing how meetings are distributed across configured meeting topics/themes. This provides insight into which advisory topics are most in demand.
Key Concepts
Portal source tracking
When a meeting is booked through a third-party portal, BookMe records both the Portal ID and the Portal Name. This allows the reporting dashboard to distinguish between different portal integrations and display them separately in the summary table and bar chart.
If a portal does not have a name configured, it will appear under a generic “Portal” label.
Percentage calculation
All percentages in the dashboard are calculated relative to the total number of meetings for the selected period and filters. For example, if 435 meetings were booked and 40 came through a specific portal, that portal shows 9%.
Data freshness
The reporting dashboard queries meeting data in real time from the Insights API. Changes to meeting bookings are reflected as soon as the data is processed by the Insights pipeline.